Market Cloud Atlas
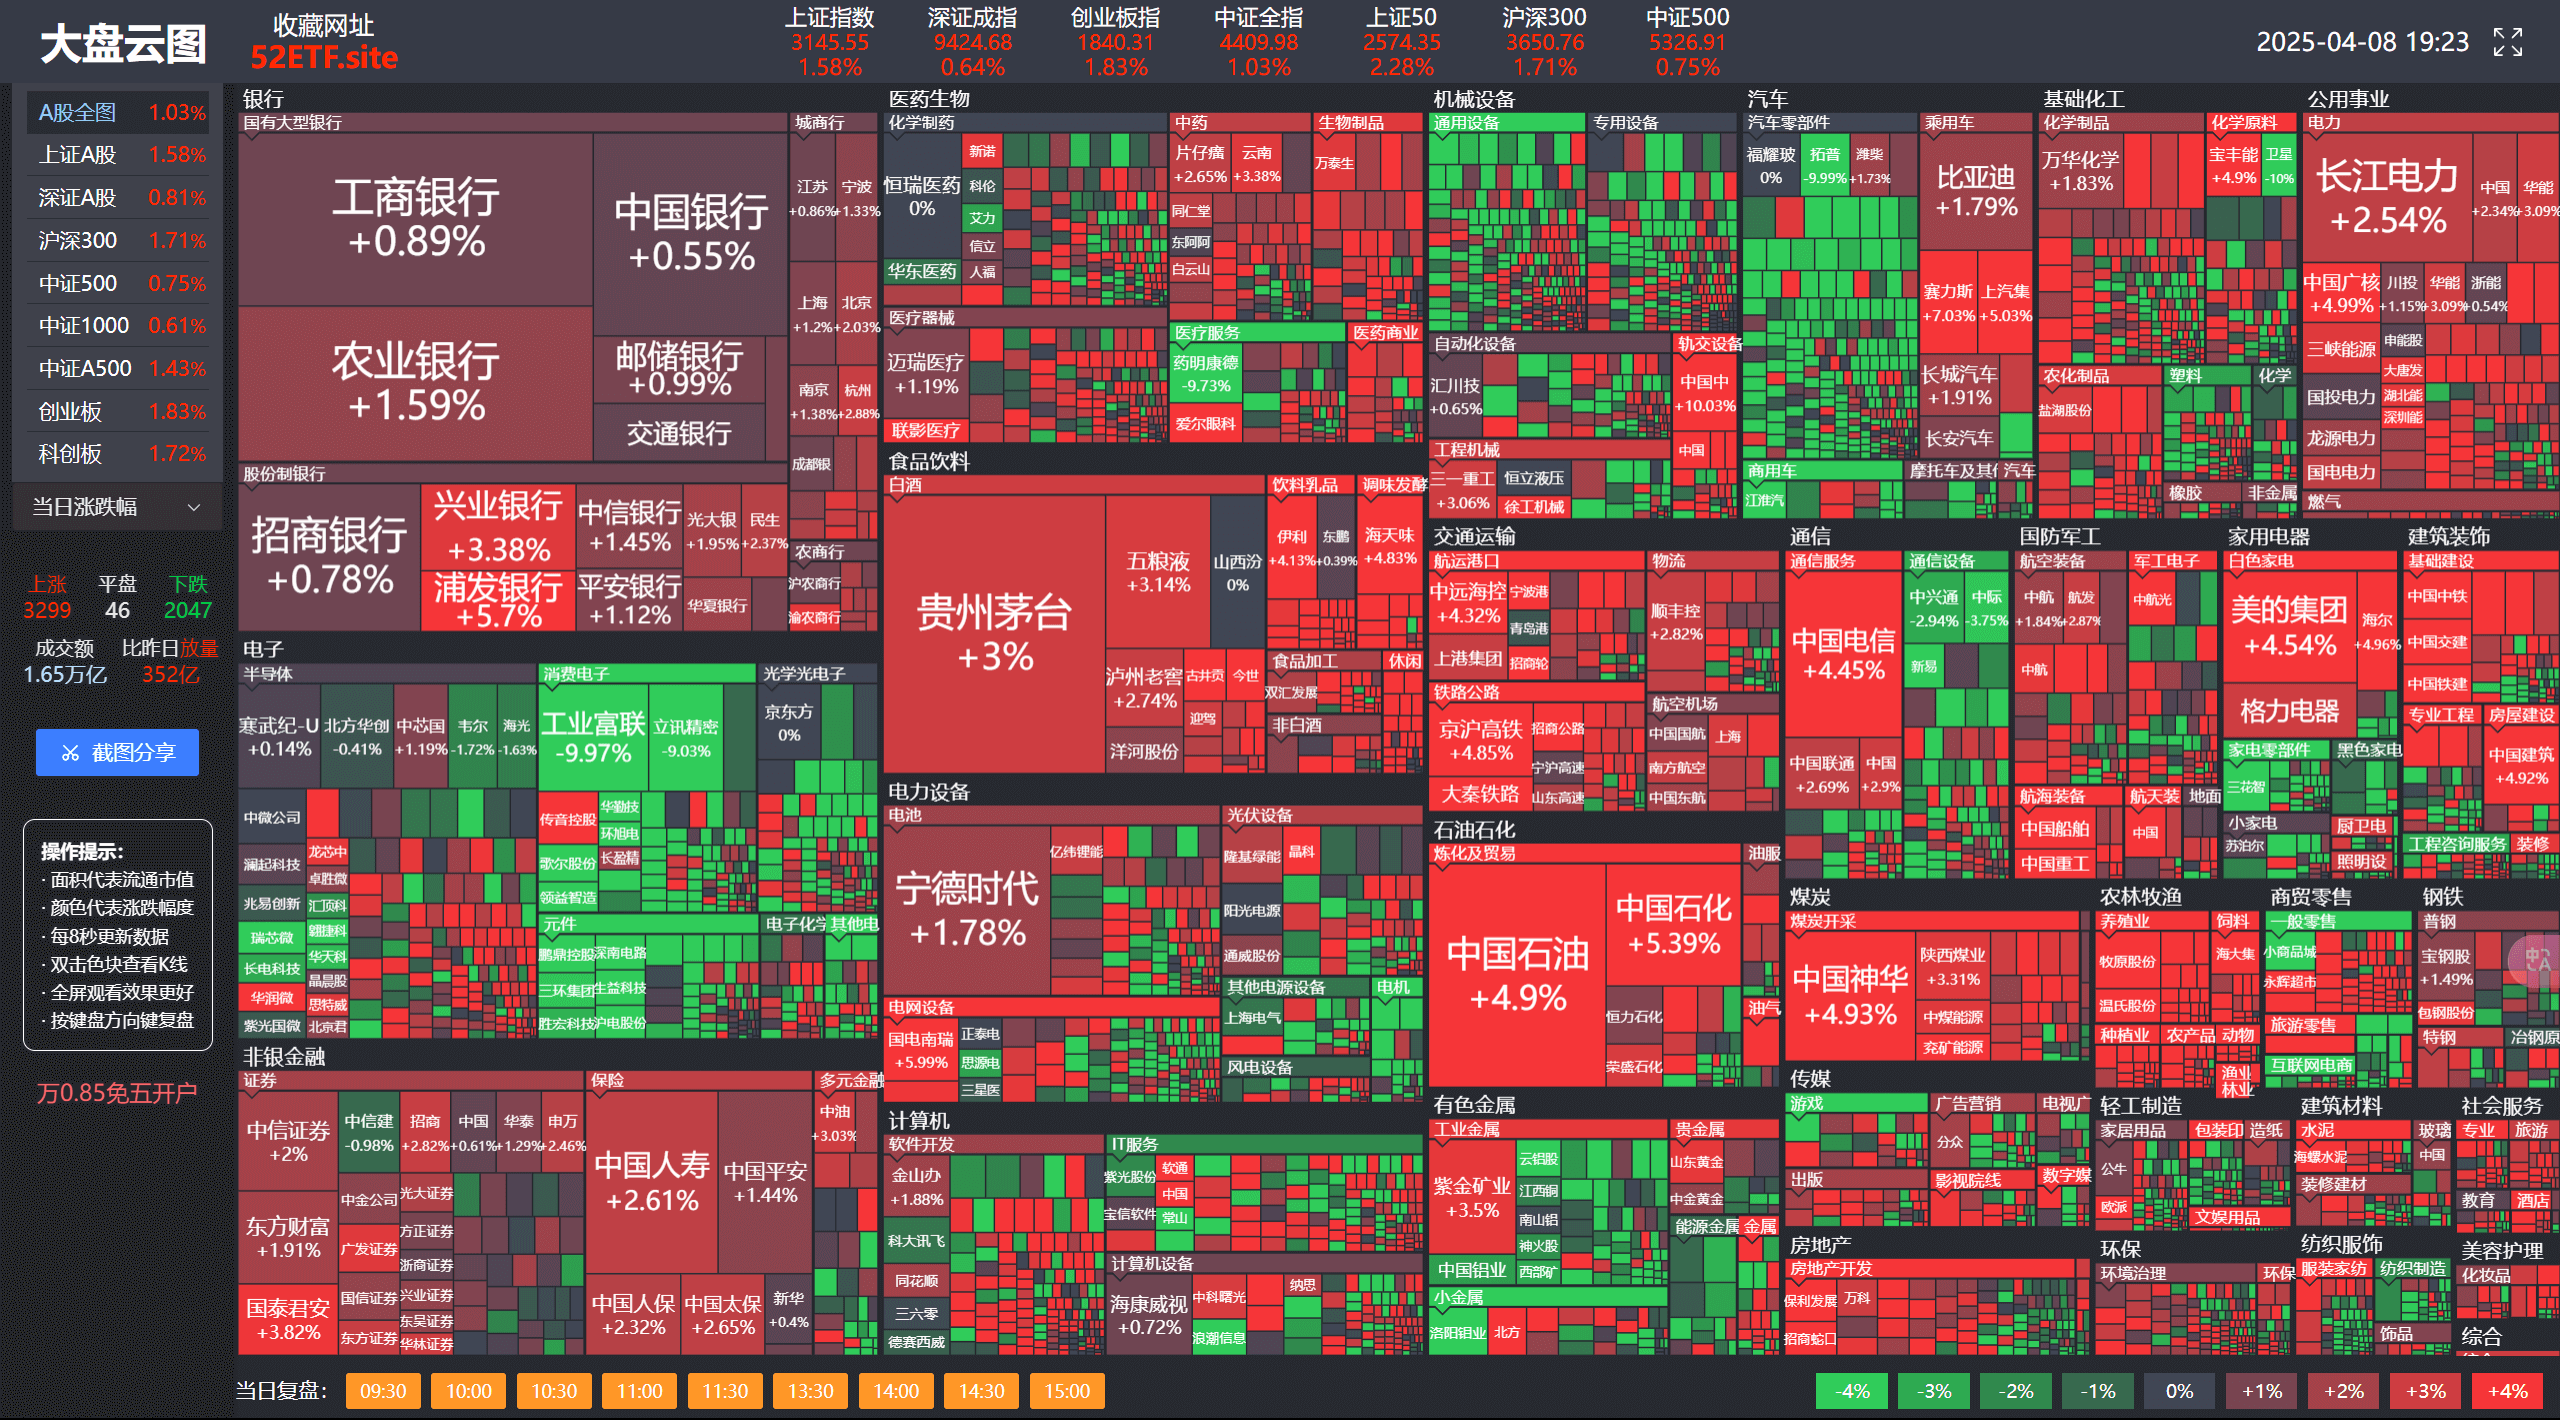
Market Cloud Chart is an online data visualization tool for the A-share stock market. It visually displays the overall stock market trends and industry sector dynamics in the form of heat maps, helping investors quickly capture market sentiment and capital flows. The color blocks are arranged according to industry and circulation market value. The color depth reflects the increase and decrease, and the area size reflects the
Introduction
Market Cloud Chart is an online data visualization tool for the A-share stock market. It visually displays the overall stock market trends and industry sector dynamics in the form of heat maps, helping investors quickly capture market sentiment and capital flows.
The color blocks are arranged according to industry and circulation market value. The color depth reflects the increase and decrease, and the area size corresponds to the circulation market value. Supports hovering the mouse to view individual stock details, and the trading session is automatically refreshed every 10 seconds. Supports playback of key period market trends from 09:30-15:00.
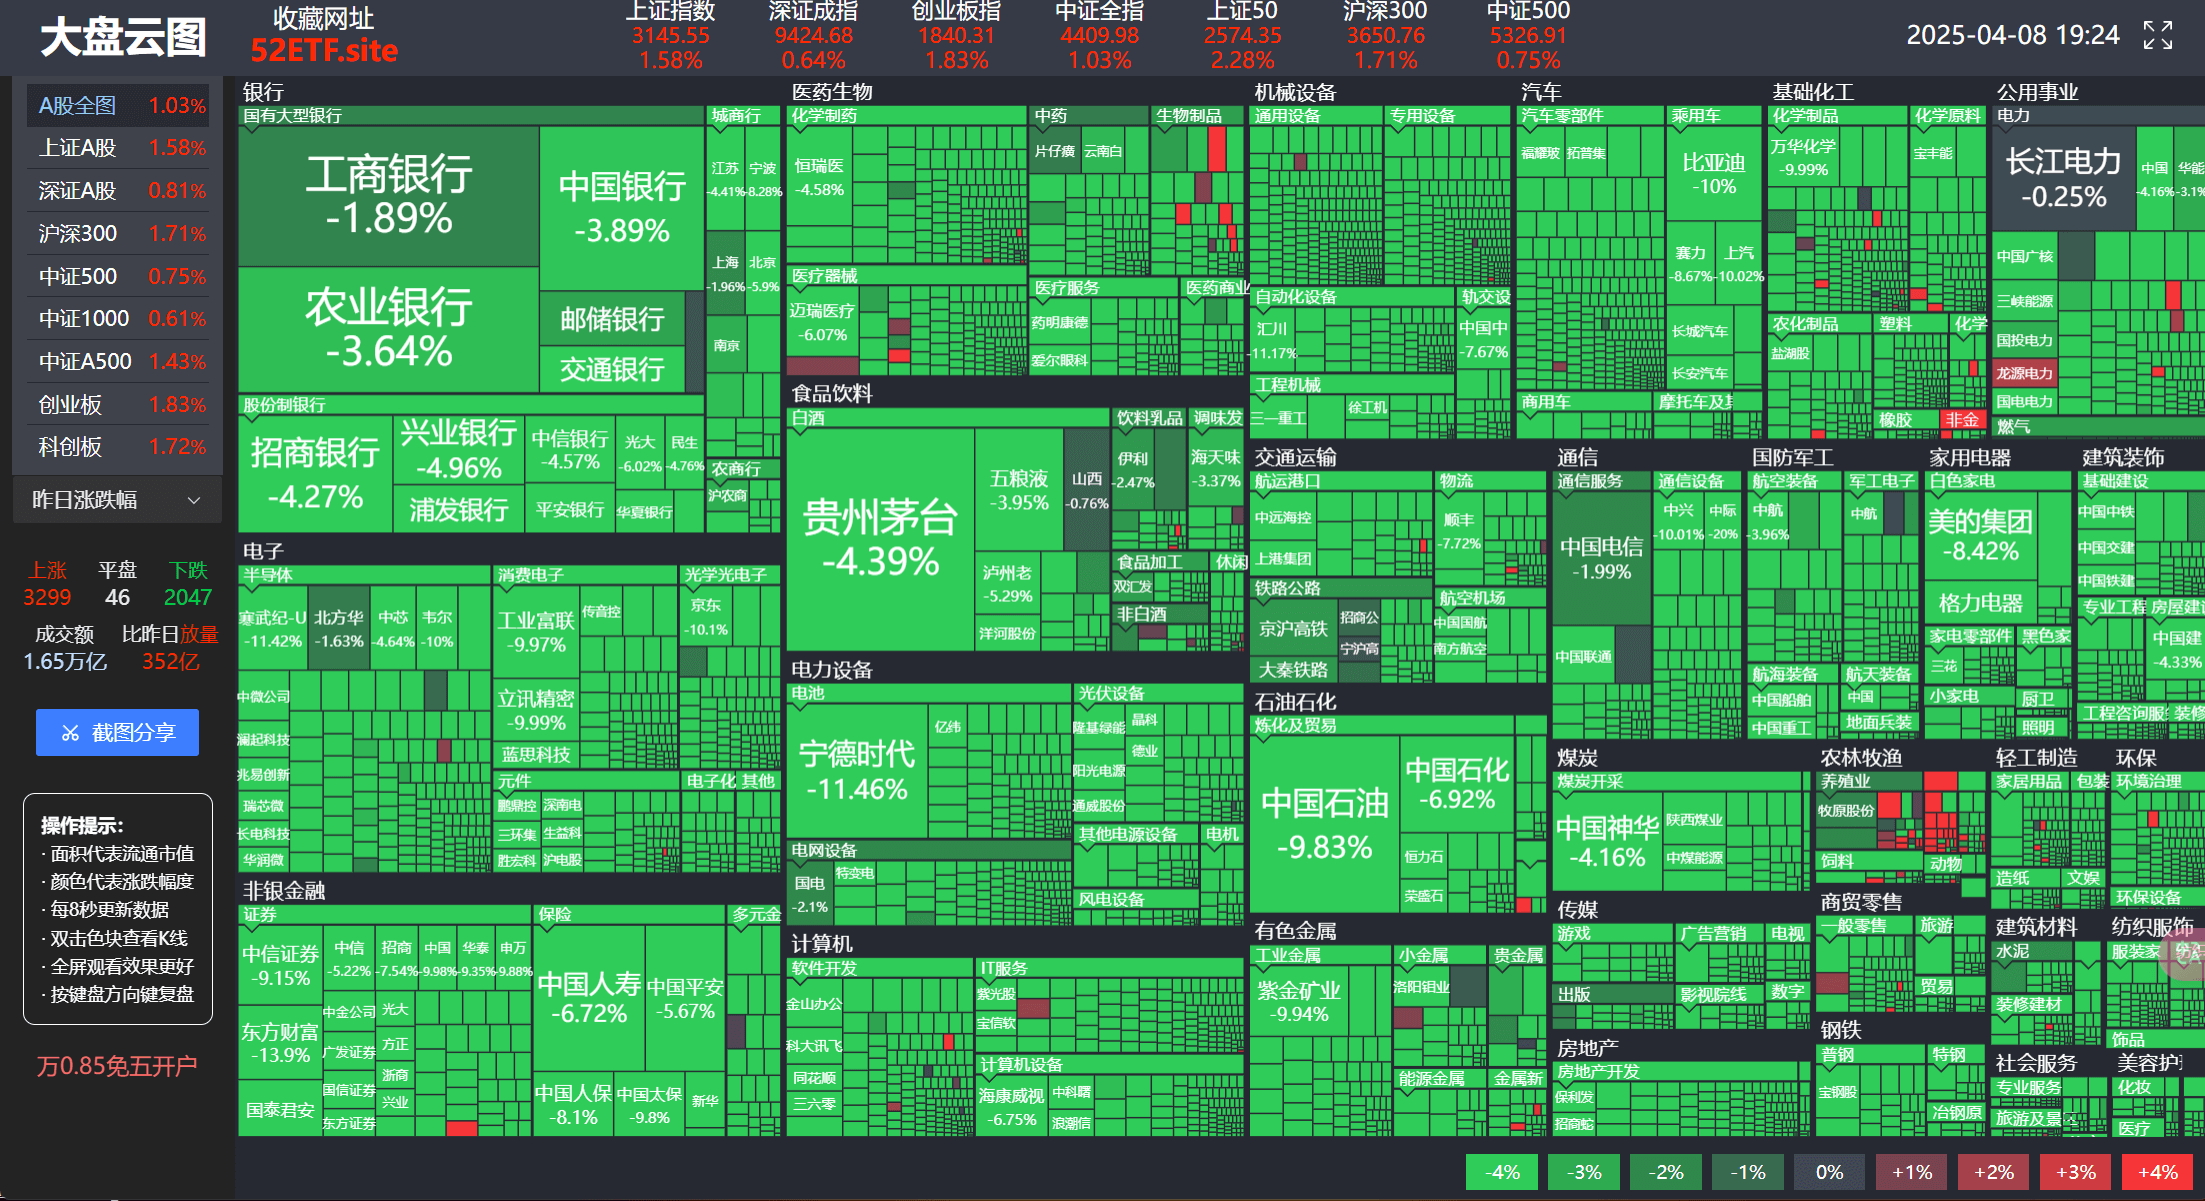
This is the AI stock market for April 7, 2025. I wonder if you are green?
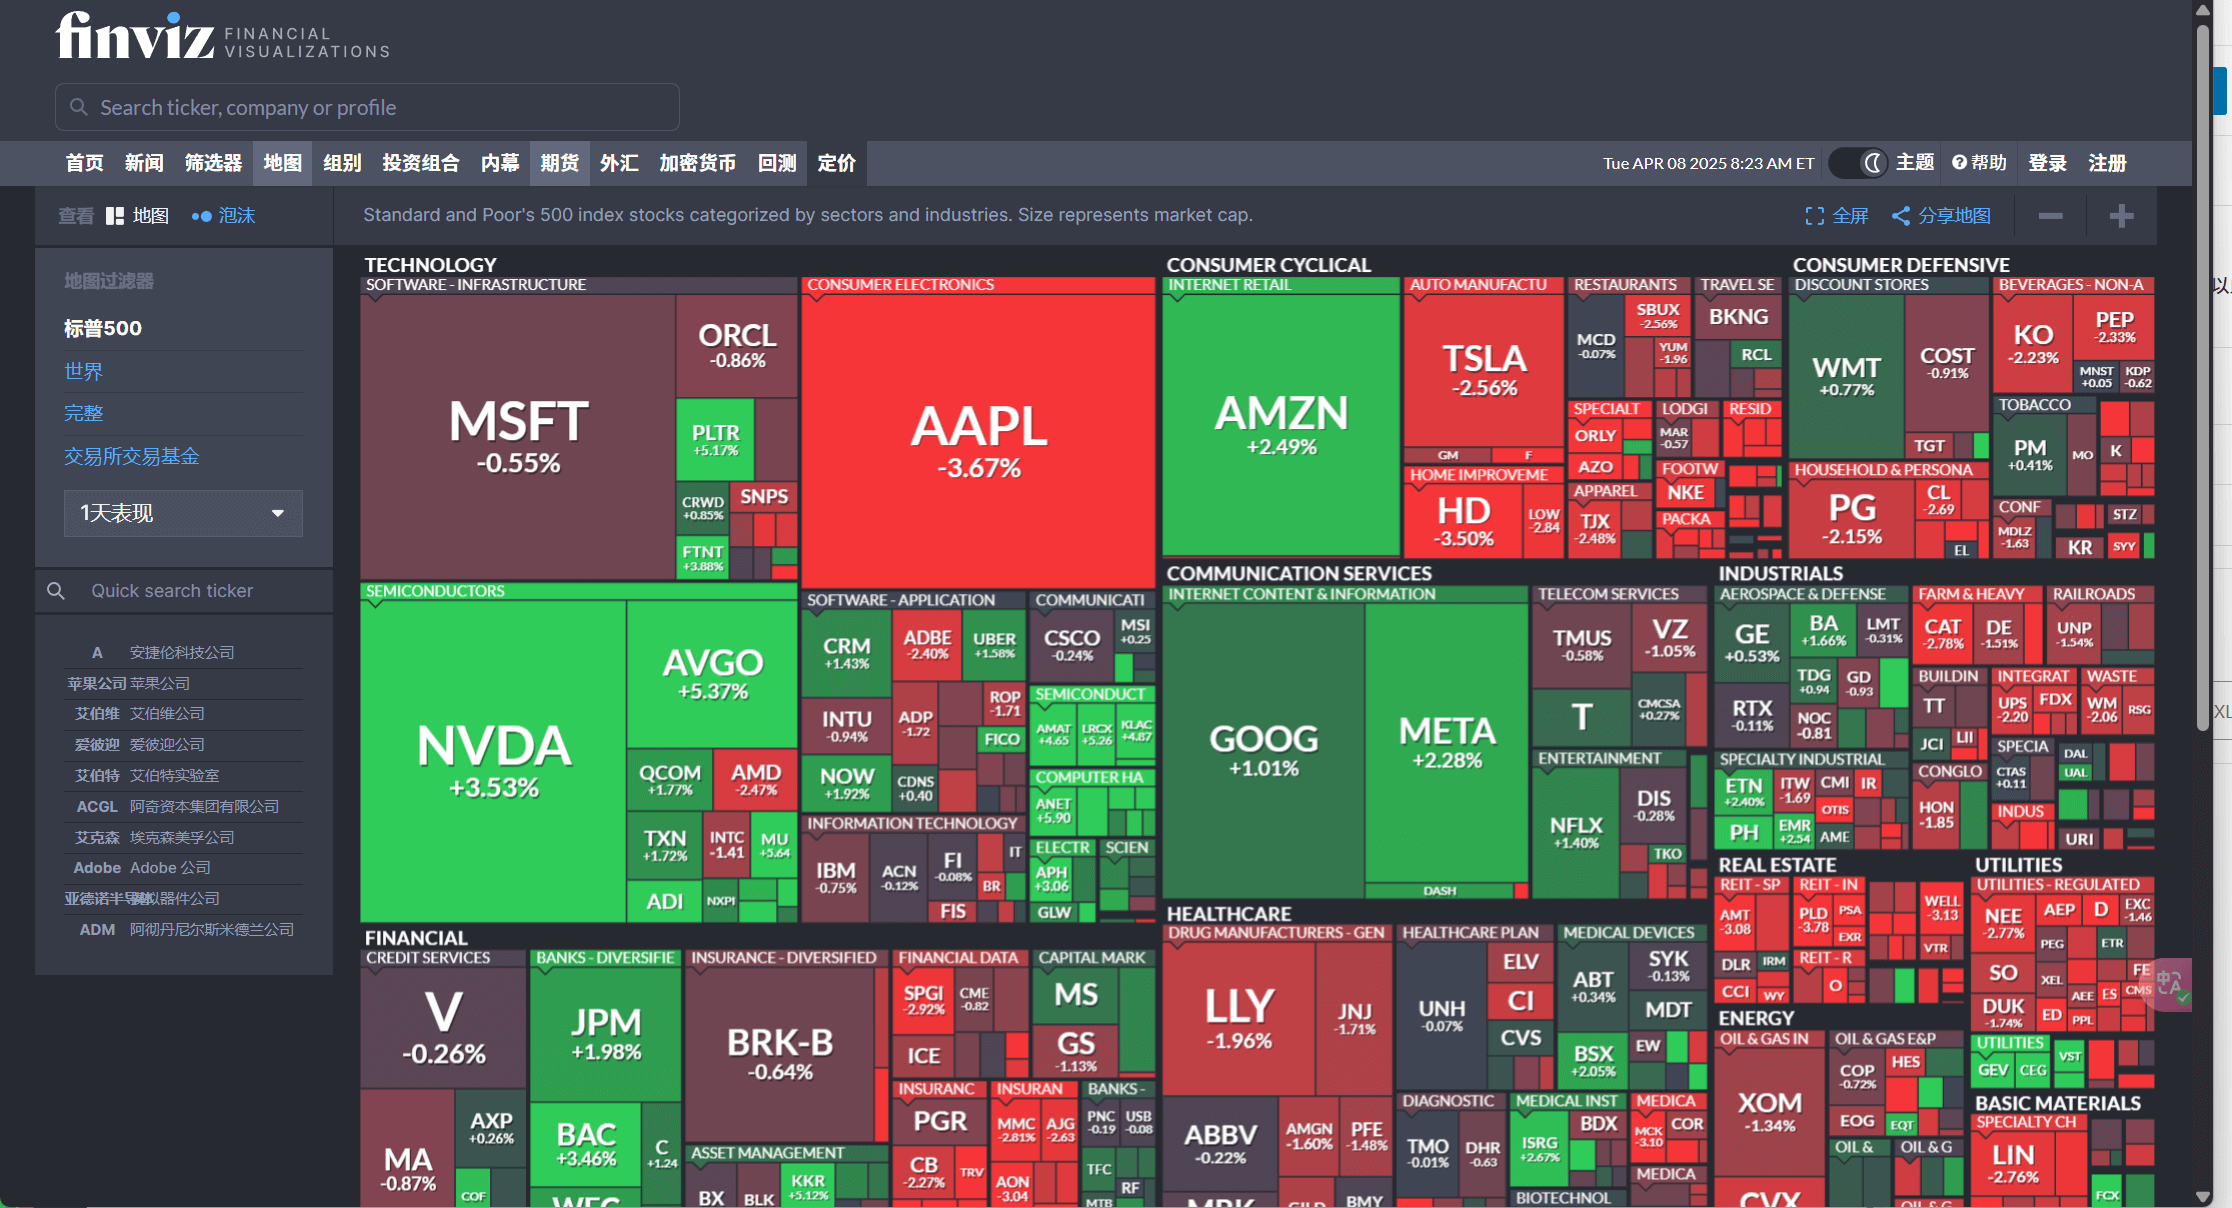
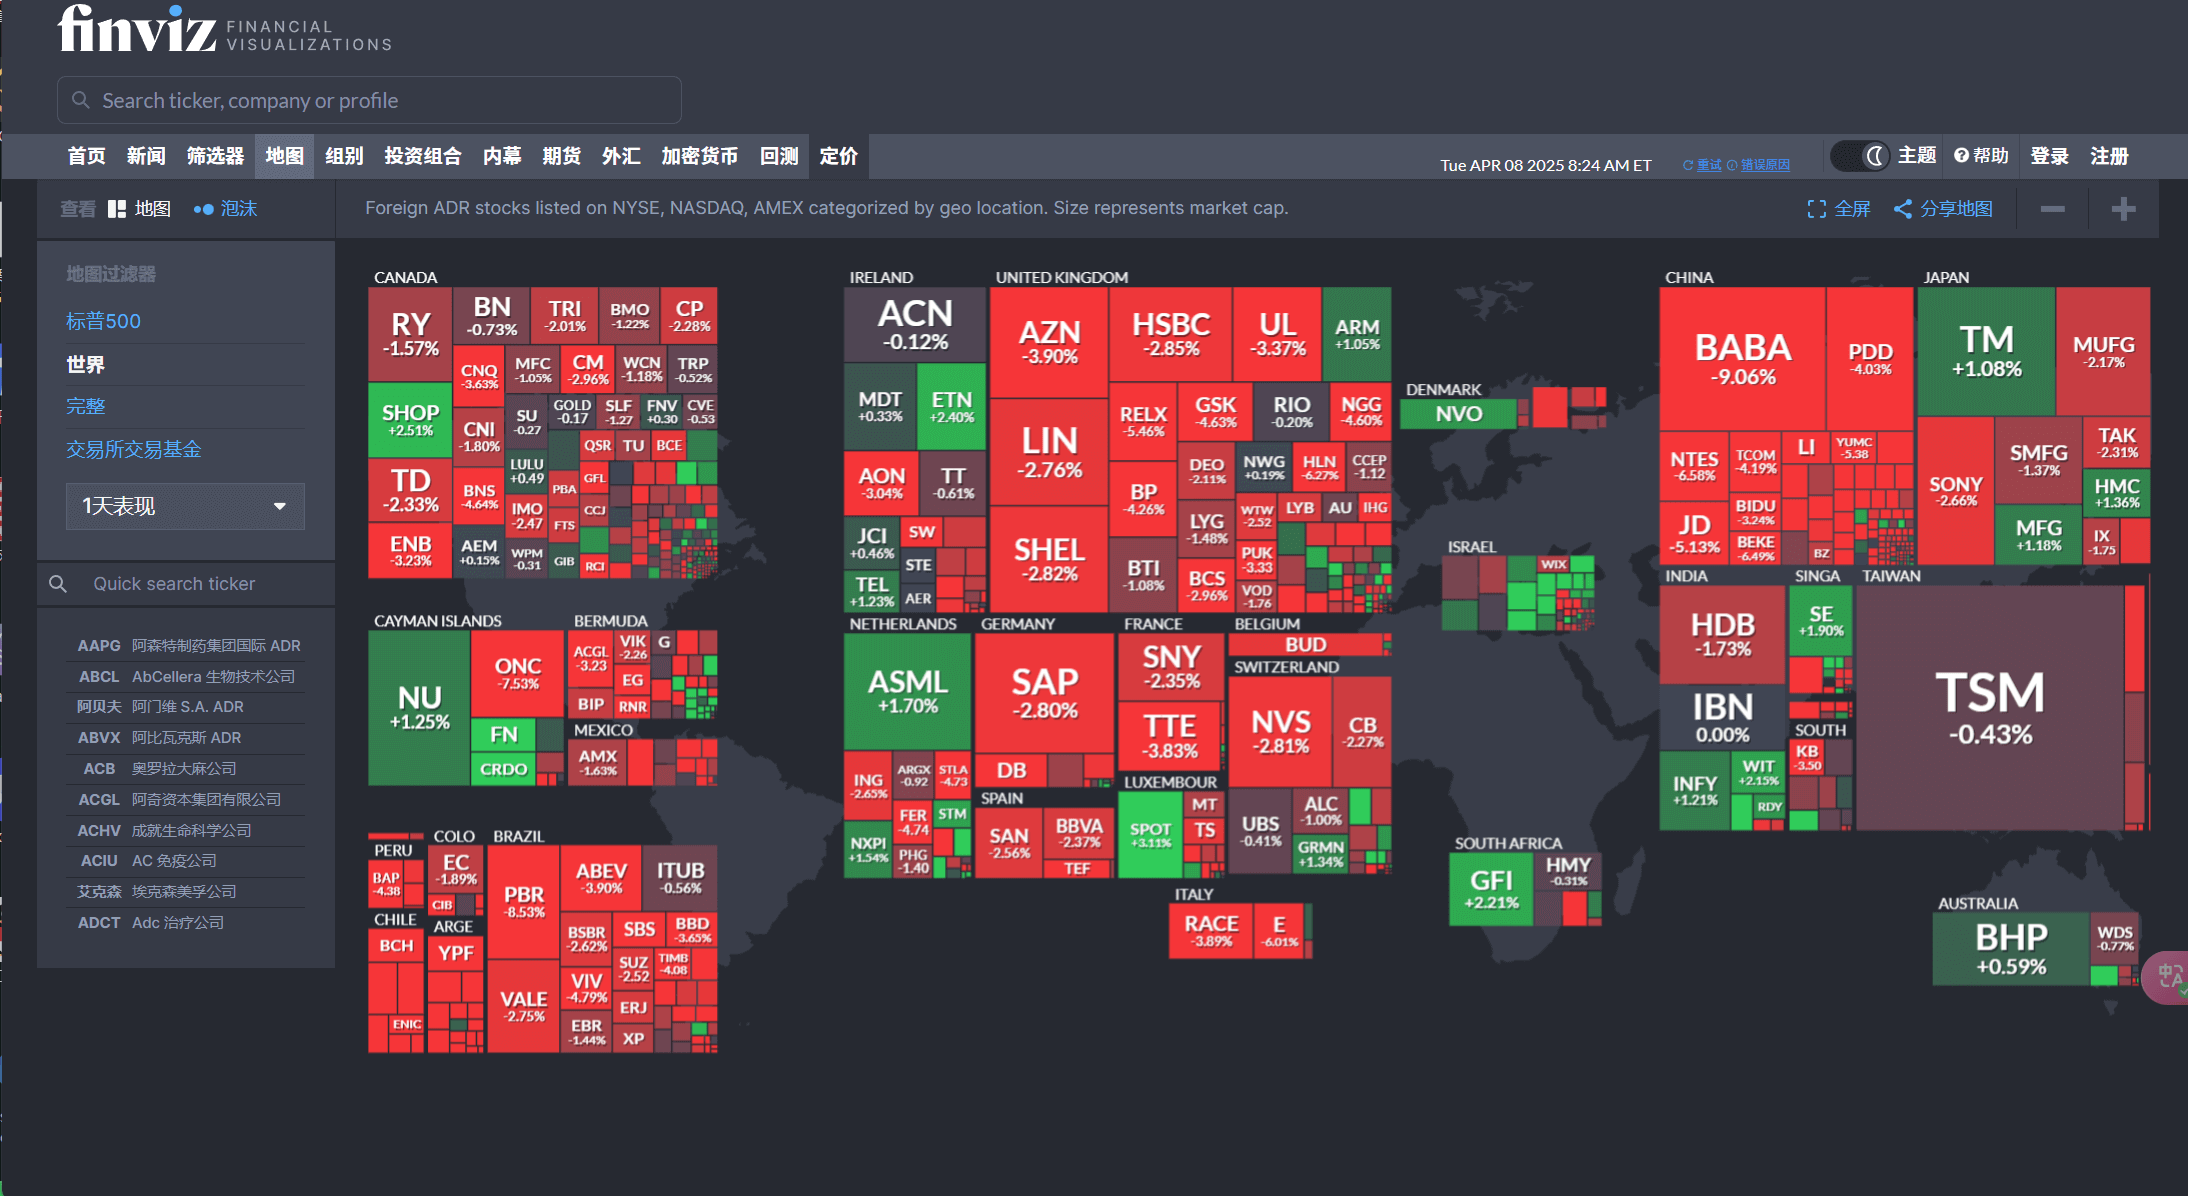
US Stock Cloud Atlas: Finviz
There is a similar cloud chart for U.S. stocks, which comes from finviz. Its function is similar to that of the A-share market cloud chart. You can view the S&P 500 heat map and the stock trading heat map of major countries around the world.